
If you want to contact me about any of this, message me on twitter @Dave_Matteo and you can check out my introduction post for this project HERE
Once again special thanks to @Golden_Fm for creating the world cup file in Football Manager I am using.
The original idea of this project was to get through 100 simulations of the 2018 FIFA World Cup then look at the results, and how the simulation results compare to both the betting odds and actual results from the World Cup. While this is still the plan I got through 100 simulations a lot quicker than I was expecting, so the current plan is to keep simulating until about a week before the World Cup stats, since the more simulations run should give a better idea of results to expect if Football Manager is an accurate simulation.
******DISCLAIMER******** So before starting this I did not realise that Football Manager doesn’t have licences for the German and Japan national teams. So the real players aren’t representing these nations although they do have fairly close approximations. Just take this into account when looking at this information.
I have been using one save for 32 simulations (32 teams in the World cup, 32 Simulations) then after the 32nd, 64th, 96th ect simulation I have started a new save file to minimise the possibility of a major injury pre World Cup leading to the skewing of results. While ideally I would start a new save for each simulation that would require a lot of extra time to set up each file, so I’ve tried to find a medium between minimising possible “errors” and easy & speed for myself.
Group A
Total wins and draws for each game in group A
| Team 1 | T1 Win | Draw | T2 Win | Team 2 |
| Saudi Arabia | 4 | 17 | 79 | Russia |
| Uruguay | 69 | 21 | 10 | Egypt |
| Egypt | 52 | 31 | 17 | Saudi Arabia |
| Russia | 32 | 29 | 39 | Uruguay |
| Egypt | 19 | 22 | 59 | Russia |
| Uruguay | 85 | 10 | 5 | Saudi Arabia |
Russia and Uruguay have dominated group A win with percentages of 56.67% and 64.33% respectively. This win rate goes up even higher if you remove the game involving both Russia and Uruguay. Against Saudi Arabia and Egypt, Russia holds a 69%-win rate and Uruguay has a 77%-win rate.
This is further displayed when Russia and Uruguay qualify from this group 78% and 92% of the time respectively.
Saudi Arabia has struggled against much stronger opponents only qualifying from the group twice
Egypt has made it out of the group 28 times
Group B
Total wins and draws for each game in group B
| Team 1 | T1 Win | Draw | T2 Win | Team 2 |
| Portugal | 76 | 20 | 4 | Iran |
| Morocco | 6 | 26 | 68 | Spain |
| Iran | 15 | 22 | 63 | Morocco |
| Spain | 45 | 31 | 24 | Portugal |
| Iran | 2 | 7 | 91 | Spain |
| Portugal | 56 | 24 | 20 | Morocco |
Group B is a very similar story to Group A with Spain and Portugal dominating, Iran struggling and Morocco being somewhere in-between.
Spain win rate is 68% and if you remove their match against Portugal it goes up to 79.5%
Similarly, Portugal holds an overall win rate of 52% and if you remove their match against Spain it goes up to 66%
Spain has qualified from the group 90 times, Portugal have qualified 77 times, Morocco has got out of the group 31 times and Iran have managed it 2 times.
Group C
Total wins and draws for each game in group C
| Team 1 | T1 Win | Draw | T2 Win | Team 2 |
| Peru | 39 | 21 | 40 | Denmark |
| France | 82 | 14 | 4 | Australia |
| Australia | 19 | 31 | 50 | Peru |
| Denmark | 14 | 22 | 64 | France |
| Denmark | 71 | 12 | 17 | Australia |
| Peru | 8 | 14 | 78 | France |
Group C has really been a story of who will get the 2nd qualifying place with France
France holds a 74.7%-win rate across all their games in the group and have qualified from the group 93 times
While Australia is lagging at the bottom of the group, with a rather disappointing 13.3%-win rate and have only got out of the group 12 times.
The real battle has been between Denmark and Peru; Denmark have qualified from the group just over half the time at 56 times. Peru aren’t too far behind having qualified 39 times.
Group D
Total wins and draws for each game in group D
| Team 1 | T1 Win | Draw | T2 Win | Team 2 |
| Iceland | 4 | 16 | 80 | Croatia |
| Nigeria | 10 | 17 | 73 | Argentina |
| Croatia | 64 | 22 | 14 | Nigeria |
| Argentina | 91 | 4 | 5 | Iceland |
| Croatia | 37 | 23 | 40 | Argentina |
| Iceland | 27 | 29 | 44 | Nigeria |
Another group dominated by 2 teams, with Croatia and Argentina really bullying the group
Argentina- 68% overall win rate Croatia – 60.33% overall win rate
Those are fairly high win rates, but Argentina vs Croatia is one of the closest matches in the whole simulation. With Argentina winning the contest 40% of the time and Croatia winning 37% of the time.
If you take that game out these two teams win rate goes right up
Argentina (without game against Croatia) – 82%-win rate
Croatia (Without game against Argentina) – 72%-win rate
Argentina has got out of the group 92 times and Croatia has qualified 81 times
Iceland has struggled through the group only beating Croatia 4 times and Argentina 5 times. If these simulations are anything to go by there will be no Euros repeat for Iceland, they have only qualified from the group 5 times.
Nigeria has got out of the group on 22 occasions.
Group E
Total wins and draws for each game in group E
| Team 1 | T1 Win | Draw | T2 Win | Team 2 |
| Switzerland | 38 | 37 | 25 | Serbia |
| Brazil | 76 | 18 | 6 | Costa Rica |
| Serbia | 14 | 22 | 64 | Brazil |
| Costa Rica | 8 | 21 | 71 | Switzerland |
| Brazil | 57 | 31 | 12 | Switzerland |
| Costa Rica | 18 | 31 | 51 | Serbia |
Much like in Group C this group has been a battle of who can make it through with Brazil.
Brazil have qualified from the group 89 times with an overall win rate of 65.67%
Costa Rica have struggled throughout the group with a win rate of just 10.67% and having qualified to the next round only 9 times.
Switzerland and Serbia have been battling for that 2nd qualifying position with Switzerland holding a small edge
Switzerland have qualified 61 times while Serbia has qualified 41 times
Group F
Total wins and draws for each game in group F
| Team 1 | T1 Win | Draw | T2 Win | Team 2 |
| Germany | 69 | 16 | 15 | Mexico |
| South Korea | 30 | 26 | 44 | Sweden |
| Sweden | 20 | 27 | 53 | Germany |
| Mexico | 45 | 24 | 31 | South Korea |
| Germany | 57 | 31 | 12 | South Korea |
| Mexico | 41 | 17 | 42 | Sweden |
Arguably the most even group in the World Cup simulations.
Germany overall hold a slight edge having qualified from the group 77% of the time and having a win rate of 59.67%
Sweden (without Zlatan) are doing pretty well for themselves having got out of the group 48 times and a win rate of 35.33%
Mexico have got out of the group 37 times with a win rate of 33.67%
As close as the win rates of Sweden and Mexico are their head to head contest may be the closest in all of the simulations. With Sweden prevailing 42% of the time and Mexico barely behind winning 41% of the time.
Meanwhile South Korea have done the best of the AFC nations having got out of the group 38 times.
Group G
Total wins and draws for each game in group G
| Team 1 | T1 W | D | T2 W | Team 2 |
| England | 76 | 17 | 7 | Tunisia |
| Panama | 100 | Belgium | ||
| Belgium | 44 | 29 | 27 | England |
| Tunisia | 73 | 16 | 11 | Panama |
| England | 99 | 1 | Panama | |
| Tunisia | 7 | 8 | 85 | Belgium |
Group G is the least competitive group both at the top and the bottom of the group.
The most obvious thing is Belgium’s 100%-win rate against Panama, and England having 99 wins against Panama.
England have qualified out of the group 93 times
Belgium have qualified from the group 96 times
With Tunisia making up the other 11 times.
This makes Panama the only team in all 100 Simulations to not qualify from their group at least once. Panama lose 90.67% of the time in this simulation.
The golden boot winner has come from this group 28 times, most likely due to the 5+ goals England and Belgium regularly score against Panama.
Group H
Total wins and draws for each game in group H
| Team 1 | T1 Win | Draw | T2 Win | Team 2 |
| Senegal | 34 | 16 | 50 | Colombia |
| Poland | 61 | 24 | 15 | Japan |
| Japan | 16 | 20 | 64 | Senegal |
| Colombia | 37 | 24 | 39 | Poland |
| Japan | 12 | 16 | 72 | Colombia |
| Poland | 57 | 14 | 29 | Senegal |
Group H is the only group without a classic World Cup Heavyweight
Poland got through the group 69 times
Colombia got through 67 times
Senegal made it through 51 times
Japan struggled the most only getting through 13 times
Colombia vs Poland is another contest that is too close to call. Currently Poland hold a 2 game edge in their head to head record (39 wins to 37 wins) but Colombia hold a very slightly higher overall win rate (53% to 52.33%).
Round of 16
Below is a chart of the nations who have qualified most frequently for the round of 16
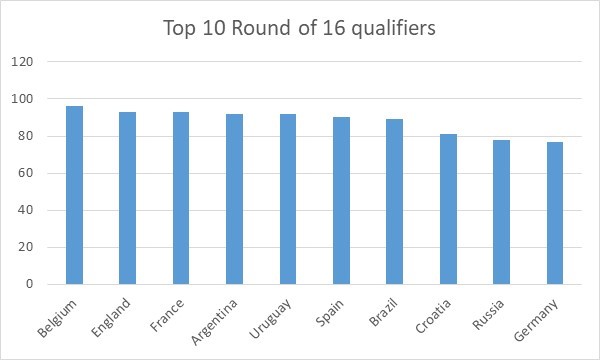
It’s a fairly unsurprising list with Belgium, England and France leading the way coming out of fairly easy groups. The rest of the teams are traditional World Cup Heavyweights, apart from Russia who get the home field advantage being hosts and come out of one of the lower quality groups.
Below is a chart of the nations who have qualified least frequently for the round of 16
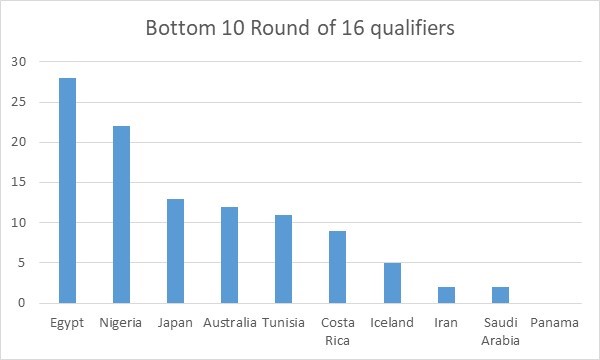
Panama are the only team who are yet to qualify to the round of 16.
Asian Confederation teams are struggling at this World Cup, with 4 of their 5 qualifiers being in this bottom 10(Japan, Australia, Iran and Saudi Arabia) with Iran and Saudi Arabia only qualifying twice each.
Quarter finals
Below is a chart of the nations who have qualified most frequently for the Quarter Finals

Unsurprisingly 8 out of the 10 teams who most frequently qualified for the round of 16 are also top 10 in qualifying for the quarter finals. Germany and Russia drop out of the top 10 qualifiers and are replaced by Colombia and Portugal.
Below is a chart of the nations who have qualified least frequently for the Quarter Finals

The 10 teams who qualified least frequently from the round of 16 continue that form to the quarter finals with Panama Saudi Arabia and Iran failing to make the Quarter finals at all.
Semi Finals
A list of every Nation who made the semi-finals at least 10 times
| Brazil | 56 |
| France | 55 |
| Belgium | 39 |
| Croatia | 31 |
| Argentina | 29 |
| Spain | 23 |
| Germany | 22 |
| England | 21 |
| Portugal | 19 |
| Uruguay | 16 |
| Colombia | 15 |
| Switzerland | 11 |
| Russia | 10 |
3rd and 4th Place Play-off
Below displays how often teams finished in 4th place(Blue) and 3rd place (orange)

Brazil, France and Belgium were the three teams who most frequently made it to the last 4 teams so it isn’t surprising they also most frequently show up in the 3rd place playoff game. All 3 teams win this game more often than losing when they participate in in it.
World Cup Final
Below displays how often teams finished in 2nd place(Blue) and 1st place (orange)
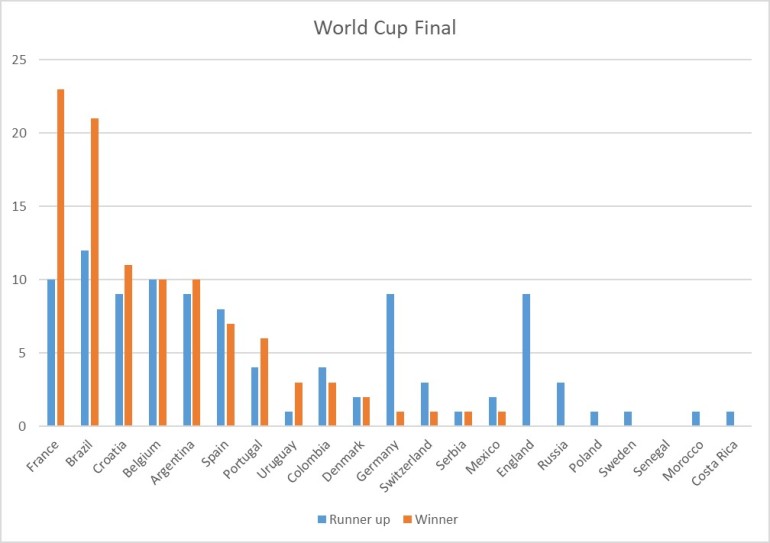
France and Brazil absolutely dominate World Cup Winners having lifted the trophy 44 times between them (France 23 times and Brazil 21 times).
Croatia has won the World Cup 11 times, with Belgium and Argentina winning 10 times.
Even after England’s early success in these simulations they are still yet to win a 2018 World Cup, finishing 2nd 9 times.
Player Awards
Rather than going through every winner of these individual awards for now I will just show how some of the more popular players performed.
Best player
Neymar is leading the best player race, having won the award 11 times but Eden Hazard is hot on his heels winning the award 10 times.
Ronaldo and Messi as always is a close run battle; however, it may be surprising how rarely the two have won the best player award. Ronaldo has won best player 3 times and Messi has won twice.
Neymar is the most expensive player in the world and his leading the best player award shows that he may be worth the money but how do the other most expensive compare?
The French duo of Pogba and Dembele are the equal 4th most expensive player however neither has managed to won best player of the tournament in any of these 100 simulations.
The 3rd most expensive player in history is Coutinho, he has managed 1 best player award.
While his French team mates haven’t won the award yet, young star and 2nd most expensive player Kylian Mbappe has been best player 6 time
| Player ranked by transfer price | Best player Awards |
| Neymar | 11 |
| Mbappe | 6 |
| Coutinho | 1 |
| Pogba | 0 |
| Dembele | 0 |
Golden Boot (highest goal scorer)
Harry Kane is leading the way having won 12 Golden boots, followed by Higuain with 9 then Mertens and Cavani with 8 each. Higuain also has the highest total for a single World Cup simulation having scored 11 goals.
Even though Neymar has won the most best player awards he is not as prolific in front of goal having won the golden boot just 2 times.
Ronaldo has been scoring more than Messi in these simulations, Ronaldo has won 5 golden boots with Messi only having 1.
The minimum number of goals to win the golden boot has been 5 with a maximum of 11. The most common number of goals to win the golden boot is 7, this has been the winning total 27% of the time. With 6 goals winning the award 26% of the time.
